Detection and Segmentation of Murine Lung Metastases Using Imalytics Preclinical
Introduction
Detecting , visualizing in 3D, localizing and quantifying the volume of tumors and metastases is one of the major applications of Imalytics preclinical.
Lung cancer are tumors orginating from lung cells. In contrast, lung metastases originate from another primary tumor such as colorectal carcinomas, breast carcinoma, renal cell carcinoma, uterine leiomyosarcoma, head and neck squamous cell carcinoma, testicular, bone, and skin cancers. In humans, lung metastases occur in about 30% of the above mentioned cancer types. Thus, lung metastases are common and are the result of metastatic spread from a variety of primary tumors via blood or lymphatics. Lung metastases can occur isolated (solitary), or lungs can also be interspersed with many (multiple) metastases. With more patients dying from metastatic burden than from primary tumors, novel tools that allow longitudinal monitoring of lung metastases in individual animal models are highly needed. Preclinical μCT imaging can meet this need.
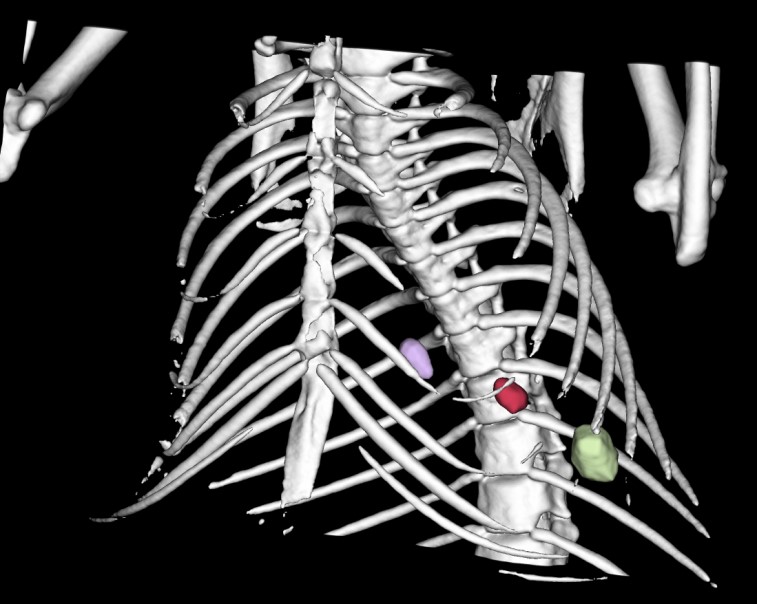
Example of segmented murine metastases with Imalytics Preclinical Software.
Data
The data set in Imalytics preclinical with a lung and three metastases can be found under Menu > Help > Tutorials > Lung metastases > Load example data set. For additional information, watch the tutorial movie about Lung metastases (Menu > Help > Tutorials > Lung metastases > Show video) or check the manual (Menu > Help > Show manual).
Detection of Lung Metastases
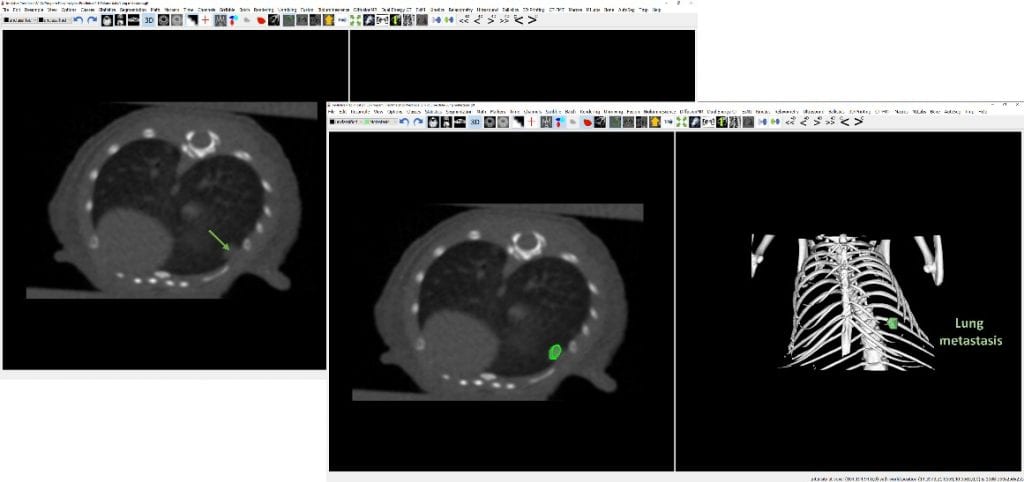
To detect and segment metastases in the lung, open a reconstructed CT dataset. Therefore, double-click on the file or, when the software is already running, press Menu > File > Open Underlay and select the CT file. Scroll to the lung tissue and zoom in as much as possible. Normally, tumors and metastases appear brighter in comparison to the surrounding lung tissue as shown in the left panel of Figure 1. A typical feature of tumors and metastases is their distinct boundaries. Nevertheless, sometimes they are hard to find. In this case, try to adjust the windowing setting. To make sure that you have segmented all metastases, perform the analysis for all time points you have acquired from one mouse and compare their location between the different scans.
Figure 1: Detection of a lung metasasis (green arrow) and segmentation using scribble drawing
Segmentation of lung metastases
For segmentation of lung tumors and metastases by manual delineation and scribble drawing, it is recommended to zoom in for higher accuracy. To be able to use the scribble mode, turn on this button: or press SHIFT + LMB (Left Mouse Button): Draw scribbles (2D only).
Before you start delineating the metastasis, press F1 to delete all existing scribbles, as you may have some scribbles in another slice. Then, create a class with the name e.g. ‘Metastasis1’ or ‘Met1’ by Right Mouse Button > Add class. Start delineating the metastasis by drawing scribbles along the boundaries in multiple slice views, for example in the axial plane (Figure 2). When you have drawn enough scribbles and the whole metastasis is encircled, press F3. The scribbles are providing a frame and the region enclosed will appear as a temporary red mask after pressing F3. You can scroll through this mask and add iteratively more scribbles, in any slicing orientation, if needed. More scribbles will enhance the accuracy of the segmentation, thus, draw more scribbles until enough accuracy is reached. By pressing F4, this red temporary mask will be assigned to the output class ‘Met1’ which will appear in red color (Figure 2). The scribbles can be only drawn in 2D, but after filling it with F4, the metastasis will also appear in 3D. You can continue with the segmentation of the other metastases, naming them e.g. ‘Met2’, ‘Met3’, etc. For further analysis, you can load an overlay, for example fluorescence intensities of an FMT data set to investigate the accumulation of a fluorescence-labelled tracer in the metastases or tumor.
Figure 2: Segmentation of a lung metastasis by scribble drawing, delineating the boundaries of the metastasis, and assign it to the respective class.
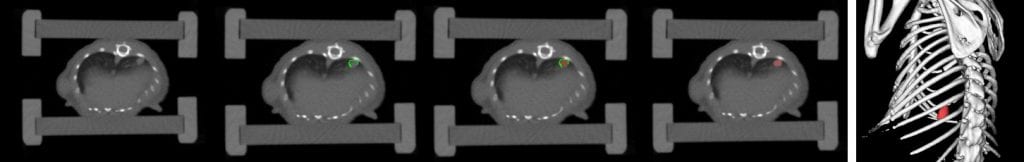
In the provided data set, the lung has three lung metastases of different sizes. They are all segmented in Figure 3 and shown in both the axial view and the 3D rendering (Metastasis 1 is hidden by the lung tissue in the 3D rendering).
Statistical Analysis of Lung Features
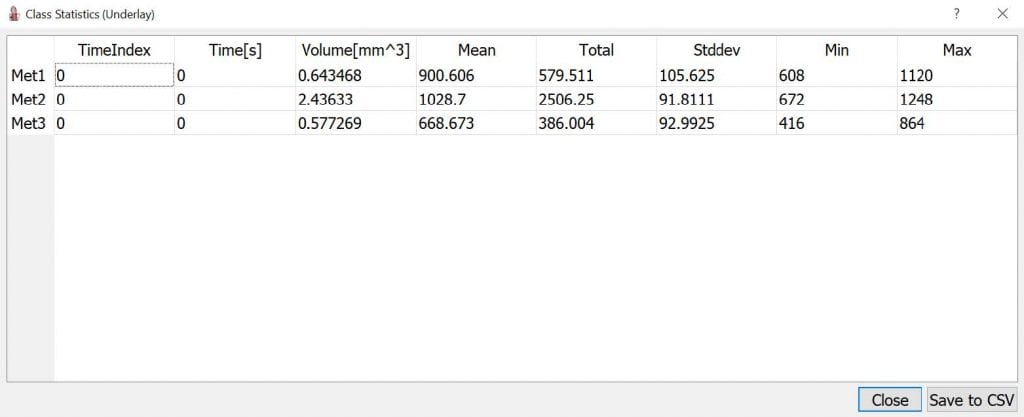
For statistical analysis, you can press Menu > Statistics > Class statistics (underlay). A table with several features of the segmented classes will appear including volume [mm.], mean, total, standard deviation, minimum, and maximum voxel values, see Figure 4. You can save this information to an excel sheet by pressing the button Save to CSV.
Figure 4: Parameters for the segmented classes.
Credit
F. Gremse, M. Stärk, J. Ehling, J. R. Menzel, T. Lammers, and F. Kiessling, ‘Imalytics Preclinical: Interactive Analysis of Biomedical Volume Data’, Theranostics, vol. 6, no. 3, pp. 328–341, 2016. doi:10.7150/thno.13624
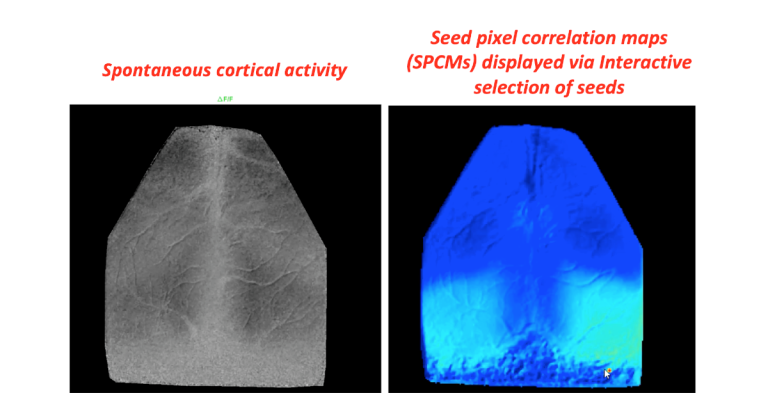
In their excellent review article titled ‘Not so spontaneous: Multi-dimensional representations of behaviors and context in sensory areas’ (ref. https://www.cell.com/neuron/pdf/S0896-6273(22)00588-8.pdf), Avitan and Stringer propose that
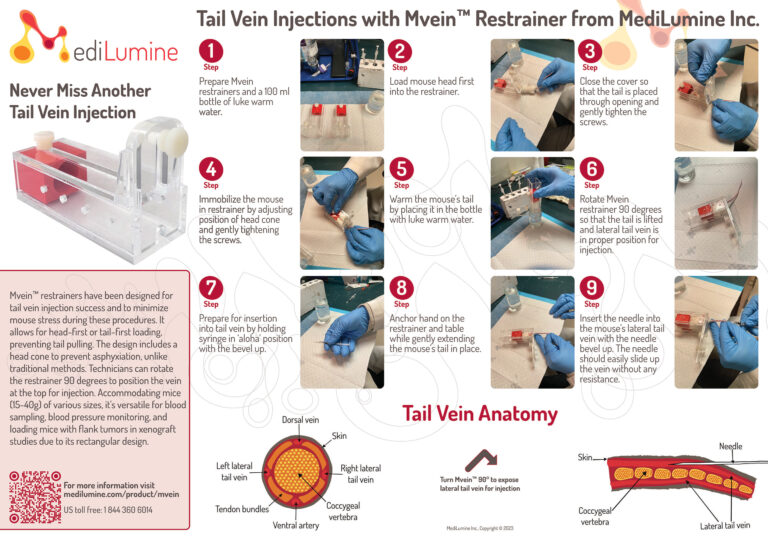
Wallchart Dimensions Width: 29.75″ – Height: 20.75″ Digital Version Download as PDF Working with tail vein injections in the lab? Request a free copy of
We use cookies for various purposes including analytics and personalized marketing. By continuing to use the service, you agree to our use of cookies. - Cookie Policy