Copyright © 2024 · MediLumine, Inc · All Rights Reserved


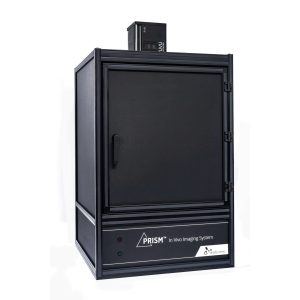
The LightTrack OiS200 for optical imaging and targeted optogenetics is a highly customizable system for in vivo experimentation. It enables scientist to simultaneously image calcium indicators, perform intrinsic optical imaging, laser speckle imaging for neurovascular coupling studies, and targeted optogenetics.
The integrated and ergonomic system allows you to save lab space and comes at an economical price point making it an ideal research companion for neuroscience, vascular biology and in vivo studies.
The technology allows for synchronization with many other types of equipment through user defined auxiliary and stimulation input/output options. Users can add two cameras and multiple illumination wavelengths allowing them to save the time required to build a customized rig.
The technology allows for synchronization with many other types of equipment through user defined auxiliary and stimulation input/output options. Users can add two cameras and multiple illumination wavelengths allowing them to save the time required to build a customized rig.

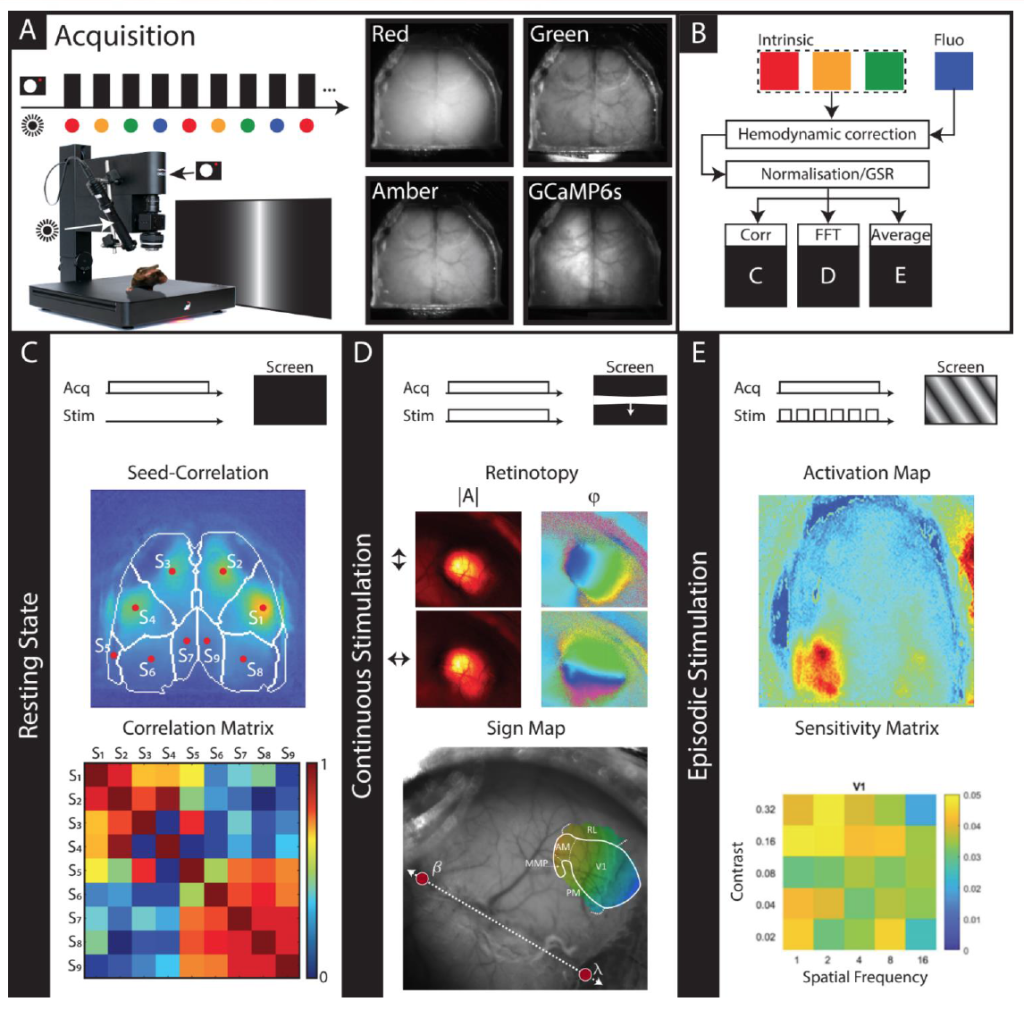
A) Example of a possible setup with visual stimulation during acquisition (left) and contrast images related to four different channels (right). B) Analysis pipeline: after classification of each channels, the fluorescence images are corrected for hemodynamic fluctuations. Then, Normalization and GSR can be applied to get the DF/F signal. Finally, 3 different paradigms are presented: Resting State, Continuous Stimulation, Episodic stimulation. C) Typical results obtained in Resting State: From the DF/F signal, the correlation matrix between each seeds (red dots). D) A periodic stimulation is presented to the mice. Then, on DF/F data, a Fourrier Transform is computed to get the amplitude and phase maps at the stimulation frequency. From these, the visual areas can be mapped on the cortex. E) Different stimulation parameters are used and repeated few times to get a good average on the response. After each set of parameters repetitions are separated, a matrix showing the maximal amplitude of the response is generated.
Movement correction method for laser speckle contrast imaging of cerebral blood flow in cranial windows in rodents. Guilbert, J., & Desjardins, M. (2022).
A Longitudinal Pilot Study on Cognition and Cerebral Hemodynamics in a Mouse Model of Preeclampsia Superimposed on Hypertension: Looking at Mothers and Their Offspring. Trigiani, L. J., Lecrux, C., Royea, J., Lavoie, J. L., Lesage, F., Pilote, L., & Hamel, E. (2021).
Developmental and interventional plasticity of motor maps after perinatal stroke. Zhang, S. Y., Jeffers, M. S., Lagace, D. C., Kirton, A., & Silasi, G. (2021).
Mesoscopic Mapping of Stimulus-Selective Response Plasticity in the Visual Pathways Modulated by the Cholinergic System. Laliberté, G., Othman, R., & Vaucher, E. (2020).
A Pilot Study Investigating Changes in Capillary Hemodynamics and Its Modulation by Exercise in the APP-PS1 Alzheimer Mouse Model. Lu, X., Moeini, M., Li, B., Lu, Y., Damseh, R., Pouliot, P., … & Lesage, F. (2019).
Correlation of hemodynamic and fluorescence signals under resting state conditions in mice’s barrel field cortex. Bélanger, S., Oliveira Ferreira de Souza, B., Casanova, C., & Lesage, F. (2016).